Drowning in Dashboards: Why More Monitoring Data Is Making Enterprise Systems Harder to Manage
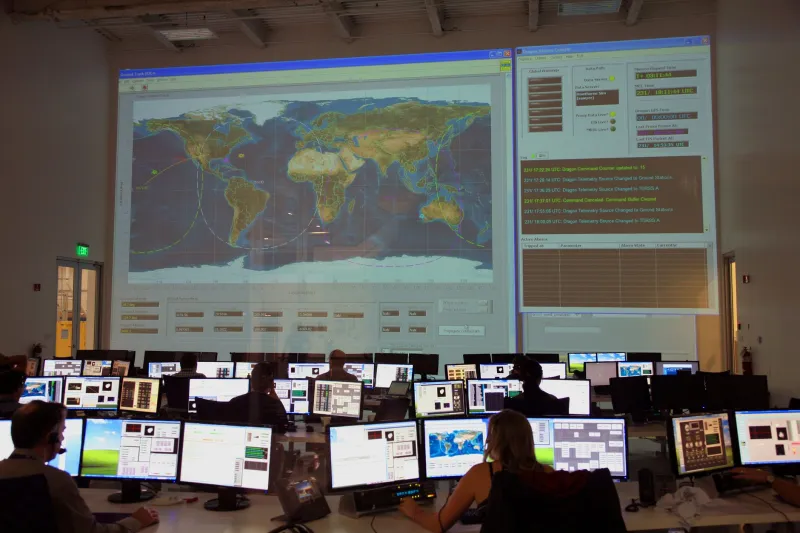
There is a particular kind of frustration familiar to anyone who has sat in an enterprise operations center at two in the morning, watching dozens of dashboards flicker with metrics, traces, and log streams — and still having no clear answer to the question that actually matters: What is wrong, and how do we fix it?
For many large organizations, this is not an exceptional circumstance. It is Tuesday.
Over the past decade, the observability market has expanded dramatically. Enterprises now deploy sophisticated logging platforms, distributed tracing tools, real-time alerting systems, and multi-layered dashboards that aggregate telemetry from thousands of services simultaneously. The pitch has always been the same: more visibility equals better control. Yet for a striking number of organizations, the opposite has proven true. The accumulation of monitoring infrastructure has not produced clarity — it has produced noise at industrial scale.
Understanding why requires an honest examination of how enterprise observability strategies are built, and where they quietly go wrong.
The Collection-First Trap
Most enterprise observability programs begin with instrumentation. Engineers add logging to services, configure metrics exporters, and deploy agents across infrastructure. The default posture is comprehensive: capture everything, filter later. This approach is understandable. In the early stages of building out monitoring capabilities, it is genuinely difficult to know in advance which signals will matter during an incident.
The problem is that "filter later" rarely happens. Teams grow accustomed to the volume of incoming data and begin treating completeness as an end in itself. Dashboards multiply. Alert rules proliferate. Retention policies expand. Before long, the observability platform has become a data warehouse of operational telemetry that nobody has the time or tooling to meaningfully interrogate.
This is the collection-first trap: the implicit assumption that gathering more data automatically produces more understanding. It does not. Data collection and data comprehension are entirely separate disciplines, and most enterprise observability programs invest heavily in the former while neglecting the latter.
When Alerts Become Background Noise
Alert fatigue is one of the most well-documented consequences of poorly structured observability programs, yet it remains endemic across enterprise environments. When monitoring systems generate hundreds or thousands of alerts per day — many of them redundant, miscalibrated, or simply informational — on-call engineers develop an entirely rational coping mechanism: they stop treating alerts as urgent signals.
The downstream effects are serious. Genuine anomalies get buried beneath routine noise. Response times lengthen. Operators begin relying on intuition and tribal knowledge rather than the monitoring systems that were supposed to replace those informal methods. The organization ends up in a paradoxical position: it has invested substantially in observability infrastructure, yet its incident response capability has not materially improved.
The root cause is almost always a failure of signal design. Effective alerting is not about capturing every possible deviation from baseline — it is about identifying the specific conditions that require human attention and ensuring those conditions are surfaced clearly, with appropriate context, and at the right time. That requires deliberate engineering work that many organizations simply have not done.
The Missing Layer: Interpretive Context
Raw telemetry data — logs, metrics, traces — describes what a system is doing. It does not, on its own, explain what that behavior means in operational terms. Bridging that gap requires a layer of interpretive context that most observability platforms do not provide by default and that most enterprise teams have not built deliberately.
Consider a straightforward example. A latency spike in a downstream service is visible in a distributed trace. But understanding whether that spike represents a transient anomaly, an early indicator of capacity exhaustion, or the symptom of a cascading failure depends on correlating that trace with deployment history, traffic patterns, infrastructure events, and service dependency maps. Without that correlation, the raw trace is informative but not actionable.
Building interpretive context means investing in a few specific capabilities that go beyond standard monitoring tooling:
- Service-level objective (SLO) frameworks that translate raw metrics into meaningful statements about user experience and business impact.
- Dependency mapping that makes the relationships between services explicit and queryable, enabling faster root-cause analysis during incidents.
- Change correlation that automatically associates observability signals with recent deployments, configuration changes, or infrastructure modifications.
- Runbook integration that connects alert conditions to documented response procedures, reducing the cognitive load on engineers during high-pressure incidents.
None of these capabilities are technically exotic. What they require is organizational commitment — the recognition that observability is an engineering discipline, not a procurement exercise.
Rethinking the Observability Investment
Enterprise technology leaders evaluating their observability posture should resist the instinct to solve comprehension problems with additional collection infrastructure. Adding another monitoring tool to an already fragmented stack rarely improves operational clarity. More often, it introduces additional integration overhead and generates yet another stream of data that nobody has a clear plan to act on.
A more productive starting point is an honest audit of existing observability assets. What signals are currently being collected? Which of those signals have demonstrably informed an operational decision in the past six months? Which alert rules have triggered meaningful responses, and which have been silently acknowledged and ignored? The answers to these questions typically reveal that a substantial portion of existing monitoring infrastructure is providing little practical value.
From that baseline, organizations can begin the harder work of building observability programs around operational questions rather than technical capabilities. The relevant questions are not "What can we measure?" but rather "What do our engineers need to know to make effective decisions during normal operations and during incidents?" That reorientation changes the design of dashboards, the structure of alerting, and the criteria for evaluating monitoring tools.
From Visibility to Intelligence
The enterprises that extract genuine value from their observability investments share a common characteristic: they treat observability as a product with internal users, not as infrastructure with a checklist of features. Operations teams, site reliability engineers, and development teams have specific informational needs at specific moments. Effective observability programs are designed around those needs.
This means building dashboards that answer questions rather than display metrics. It means designing alert policies that escalate with precision rather than volume. It means maintaining service catalogs and dependency documentation that give on-call engineers the context they need to act quickly and confidently. And it means establishing feedback loops between incident response and observability design, so that each operational event produces improvements to the monitoring systems themselves.
The goal, ultimately, is not to see more — it is to understand faster. In complex enterprise environments, that distinction is not semantic. It is the difference between an operations team that is perpetually reactive and one that is genuinely in control.
For organizations that have invested heavily in monitoring infrastructure and are still struggling to translate that investment into operational confidence, the path forward is not another tool. It is a strategy.